Column
Last updated
Last updated
To drill into the column-level statistics, click on the column name in the Datasets entity tree, or click on the linked column name in the Written Data Statistics table in the Schema tab. This tab is visible for datasets ingested and transformed by Upsolver.
This column type that was automatically inferred by Upsolver during ingestion, and is useful for comparing source and target schemas to ensure data is stored in the correct and expected type.
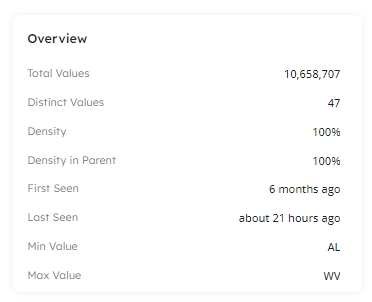
The following information is provided for your selected column:
| Measurement | Description |
|---|---|
Total Values | Total number of rows with a non NULL value. |
Distinct Values | The count of distinct values within the column. |
Density | The percentage of rows that have a value. |
Density in Parent | The percentage of rows that have a value. |
First Seen | The first date and time that data was written in this column. |
Last Seen | The last date and time that data was written, or updated, in this column. |
Min Value | The lowest value in the column in the dataset, available for string, date, and numerical data. |
Max Value | The highest value in the column in the dataset, available for string, date, and numerical data. |
The Written Rows Over Time chart will help you become familiar with the volumes of data ingested, enabling you to determine an expected baseline. This visual displays the number of rows ingested over the selected timespan, enabling you to quickly discover spikes or drops in your data to troubleshoot unexpected volumes.
Click on the Lifetime button to change the timespan displayed in the dataset report:
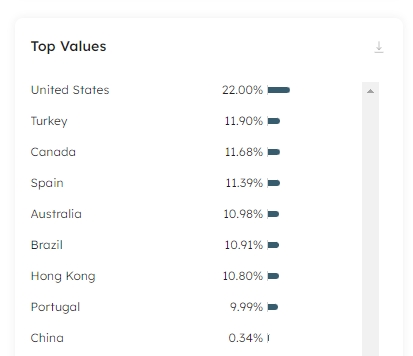
The Values by Frequency card displays the top 10K distinct values in the selected column and the percentage of rows for each value that appears within the dataset. This is particularly helpful for columns written to dimensions, as the values here should match the values in your analytics target:
For datasets written to the data lake, you can download the results in the Values by Frequency card to a column inspections CSV file to further investigate your data. Click on the Download icon in the top right-hand corner of the card to download your file. The file includes the list of distinct column values, the number of times each value appears in the dataset, and the percentage breakdown representing the density of the value within the column.
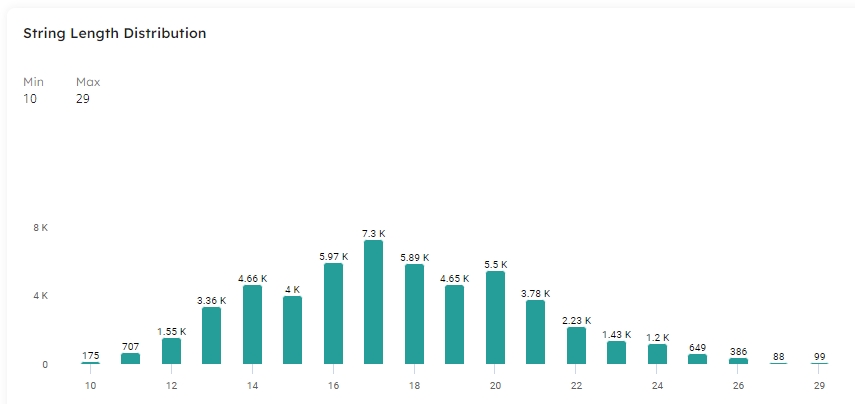
The column data type determines the label of the distribution card, either String Length Distribution for a string type column, or Values Distribution for date and numeric types.
If you discover data that frequently falls outside of your remit, you can use expectations in your job to warn of errant rows, or eliminate them from your target dataset, thereby preventing bad data from polluting downstream analytics data.
The Distribution card enables you to easily discover anomalies or incorrect string data, for example if you are expecting a fixed-width character length, or values to be within a range.
The Min and Max stats provide real-time visibility into the strings in your columns. If you have a column whereby the minimum string length should be 13, such as a barcode field, you can use this card to check ingested values.
For example, the following chart displays a visual representation of the string length distribution for the values within an address1 column:
The chart instantly alerts us to any strings that may be too long or too short, indicating an an issue in our data.
The Values Distribution chart makes it easy to visualize your data and find anomalies and outliers. It is easy to see the spread of values across the range within your dataset and also discover the Min and Max values within the column.
In the following example, we can see that the minimum value for the nettotal column is 1,331.02, and the maximum value in 4,457.55. However, 48.8K rows have a value of 0. As this is the nettotal value, we may need to investigate further to check if this is correct. It might be that we have missing data, or simply that we have a high number of customers in an open shopping session that have not added anything to their basket yet. If we don't want rows with a 0 value for nettotal to reach our data warehouse, we can add an expectation to the job to filter out these rows:


