Monitoring- V1
This page describes the job Monitoring tab for database sources.
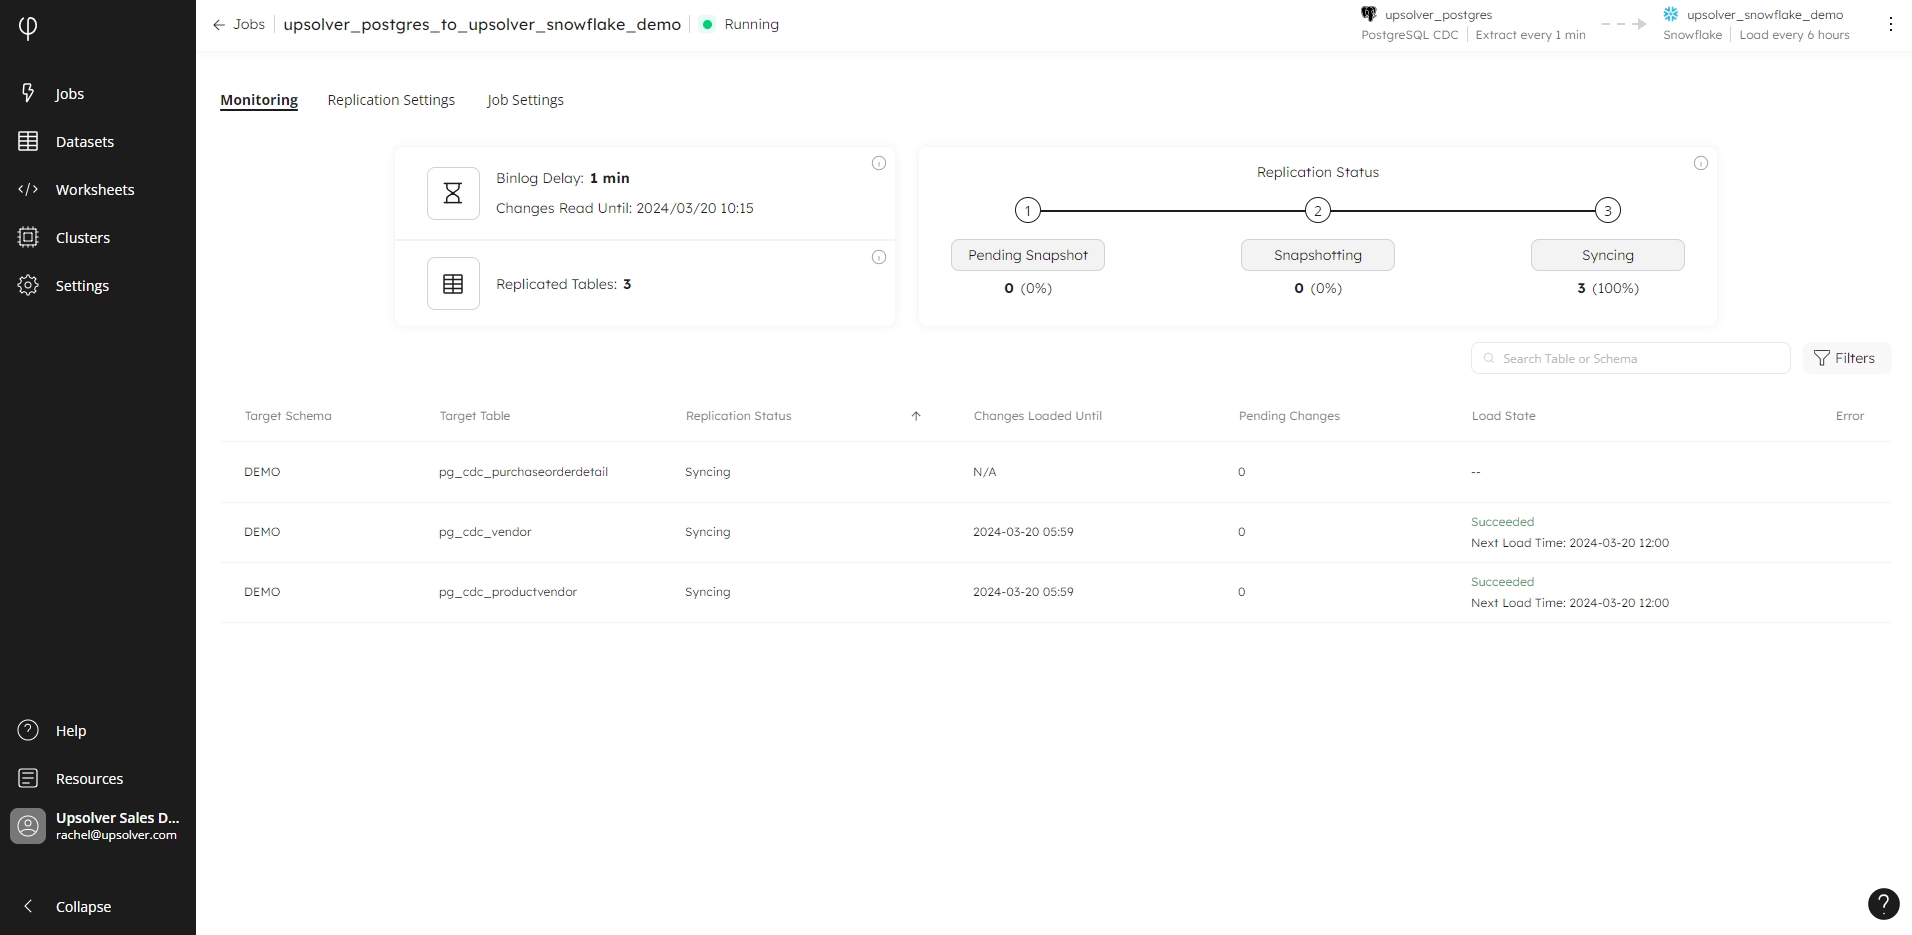
The Monitoring tab provides insight into the status of your CDC job, from job level, through to individual tables within the replication. The metadata updates in real time, ensuring you have the latest information possible about the status of your job:

Job header
In the top left-hand corner of the tab is the name of your job, along with the status, e.g. Running, and color-coded icon to alert you to any errors or warnings so you can take appropriate action. If your job has an error, the error message is displayed across the top of the tab
In the top right corner, the tab displays the source and target where the job ingests the data from and to. The source includes the frequency of the extract, e.g. Extract every 1 minute, and the target includes the frequency of the load, or how often data is written, e.g. Load every 6 hours.
Click on the three-dots menu to show the options to Pause Load to Target, or Drop Job. Each option opens a modal dialog asking you to confirm your selection.
Overview
The following information is available for your job:
Binlog Delay: the duration passed since the last time a change was read from the binlog. Reading from the binlog is performed every minute.
Changes Read Until: the date and time when the changes were last read from the binlog.
Replicated Tables: the number of tables being replicated.
Replication Status: the current status of the table replication. A table can be in one of the following states:
Pending Snapshot: the number and percentage of tables in the replication that are pending snapshot.
Snapshotting: the number and percentage of tables in the replication that are currently being snapshotted by the job.
Syncing: the number and percentage of tables in the replication that have been snapshot and are now synchronizing between source and target.
Replication table
The replication table displays the status of each table within the replication. Use the search box to display a subset of tables, or click on the Filters icon to filter the table results by Replication Status, Load State, and/or Has Errors.
Target Schema
The target schema where the data is loaded.
Target Table
The name of the target table in the destination.
Replication Status
The current status of the data load, e.g. Pending snapshot, Snapshotting, or Syncing.
Changes Loaded Until
The point in time that the last changes from the source table were successfully loaded into the target database. The date signifies the last synchronization point and indicates the data's status in the target table, reflecting the time up to which it is synced with changes made in the source table.
Pending Changes
The number of changes extracted from the binlog that have not been loaded to the target yet.
Load State
The status of the task loading the changes to the target, performed according to the interval defined when creating the job. Displays the status, e.g. Succeeded or Failed, alongside the datetime stamp when the data will next load.
Error
The latest error encountered while processing the table's data.
Last updated
