Graphs
This page describes how to extract useful information to monitor and troubleshoot your jobs using the job status visuals.
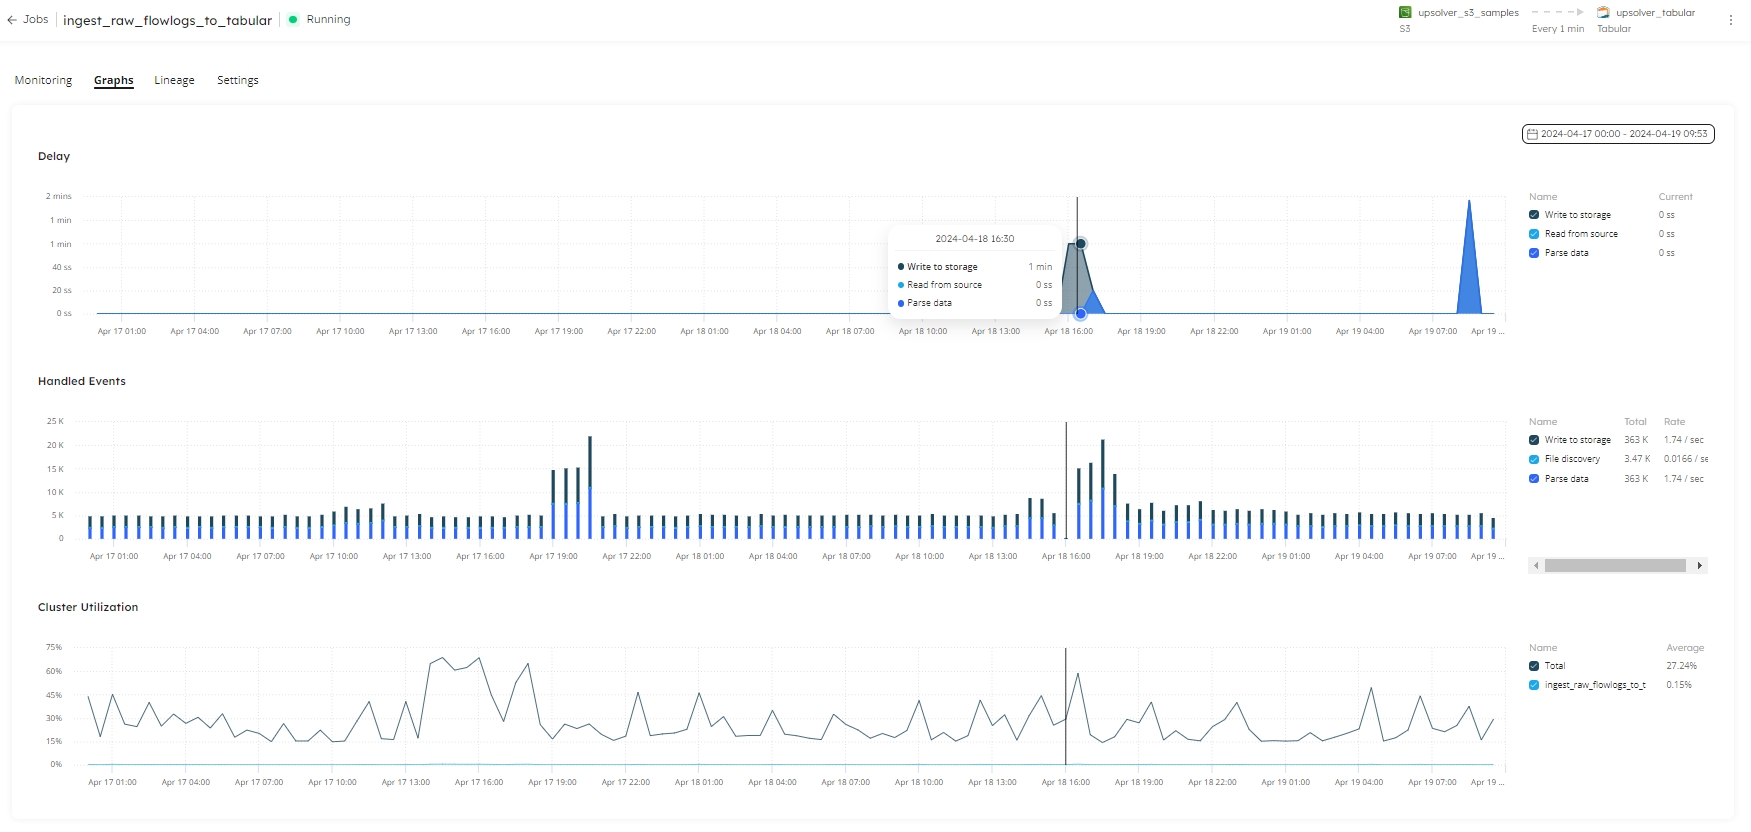
The Graphs tab visualizations deliver immediate insight into the performance of your job over a given period of time, enabling you to discover delays, the number of events that were handled, and how the cluster has been utilized.
Delay
The Delay chart visually displays delays in write to storage, read from source, and parse data for your job. Depending on the job type, you may see only one of these options:

Handled Events
The Handled Events chart displays write to storage, read from source, and parse data over the time period selected in the date picker:

Cluster Utilization
The CPU utilization of the cluster. The chart visualizes how much of the server's processing capacity is currently in use, and includes the current job:

Customize the view
ou can use the Today button to set the time span of this view. Choose the pre-set options, such as Last 30 minutes, or Last 12 hours to set the view, or use the calendar to select the start date and time, and the end date and time.
Then, you can hover your mouse over a point in time on any of the charts to display the pop-up that shows the metrics for the selected point in time:

