Optimize Your Iceberg Tables
This how-to guide takes you through the steps to analyze your Apache Iceberg tables to discover which files require optimization, and how to run the Upsolver Iceberg Table Optimizer.
Upsolver's Iceberg Table Optimizer helps you reduce the storage costs of your Apache Iceberg tables, and improve data scan performance for faster querying. You don't need to use Upsolver to ingest your data in order to benefits from the Iceberg Table Optimizer: the Iceberg Table Optimizer runs independently, so you can improve your existing lakehouse without manual performance tuning.
When you select tables for tuning, Upsolver automatically manages them for you, so no intervention is required. You can add or remove a table from the optimization process at any time, and statistics are continuously updated to enable you to monitor the improvements within your partitions.
This guide illustrates how to connect to your data catalog and analyze your tables for potential performance improvement. You will discover which tables will benefit the most from compaction, and run the optimizer to tune the tables. You will then view the metrics within Datasets to see the benefits, and then learn how to remove a table from the optimizer.
Follow these steps to learn how to:
Connect to your catalog
View the statistics for a table and its underlying partitions
Add tables to the optimizer
Review the code and run the optimizer
Understand the metrics in Datasets
Remove a table from the optimizer
Prerequisites
Please create an Upsolver trial account if you have not signed up yet. Get started at https://sqlake.upsolver.com/signup.
You will need the credentials to your data catalog, or a connection you have already created in Upsolver, either AWS Glue Data Catalog or Tabular.
An Apache Iceberg lakehouse should already exist on your cloud storage.
Step 1
Connect to your catalog
The first step is to connect to your data catalog. From the home screen in Upsolver, click Optimize My Iceberg Tables to open the wizard:
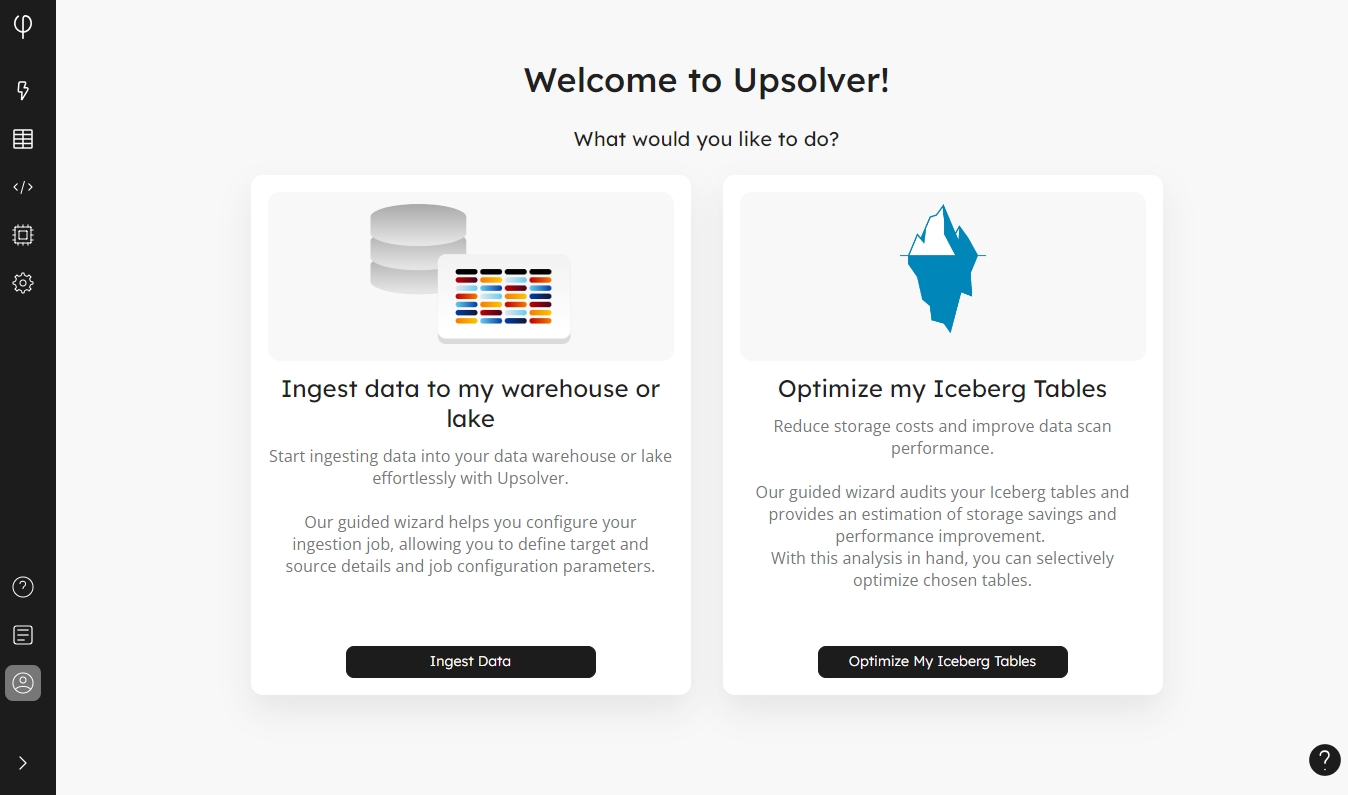
If you don't see the above screen when you login, click on the Upsolver logo in the top of the menu on the left-hand side of the window, then click Optimize My Iceberg Tables.
In the Select Catalog list, choose AWS Glue Data Catalog or Tabular. This displays the connection card. Choose Use an existing connection if you have already created one in Upsolver, or choose Create a new connection.
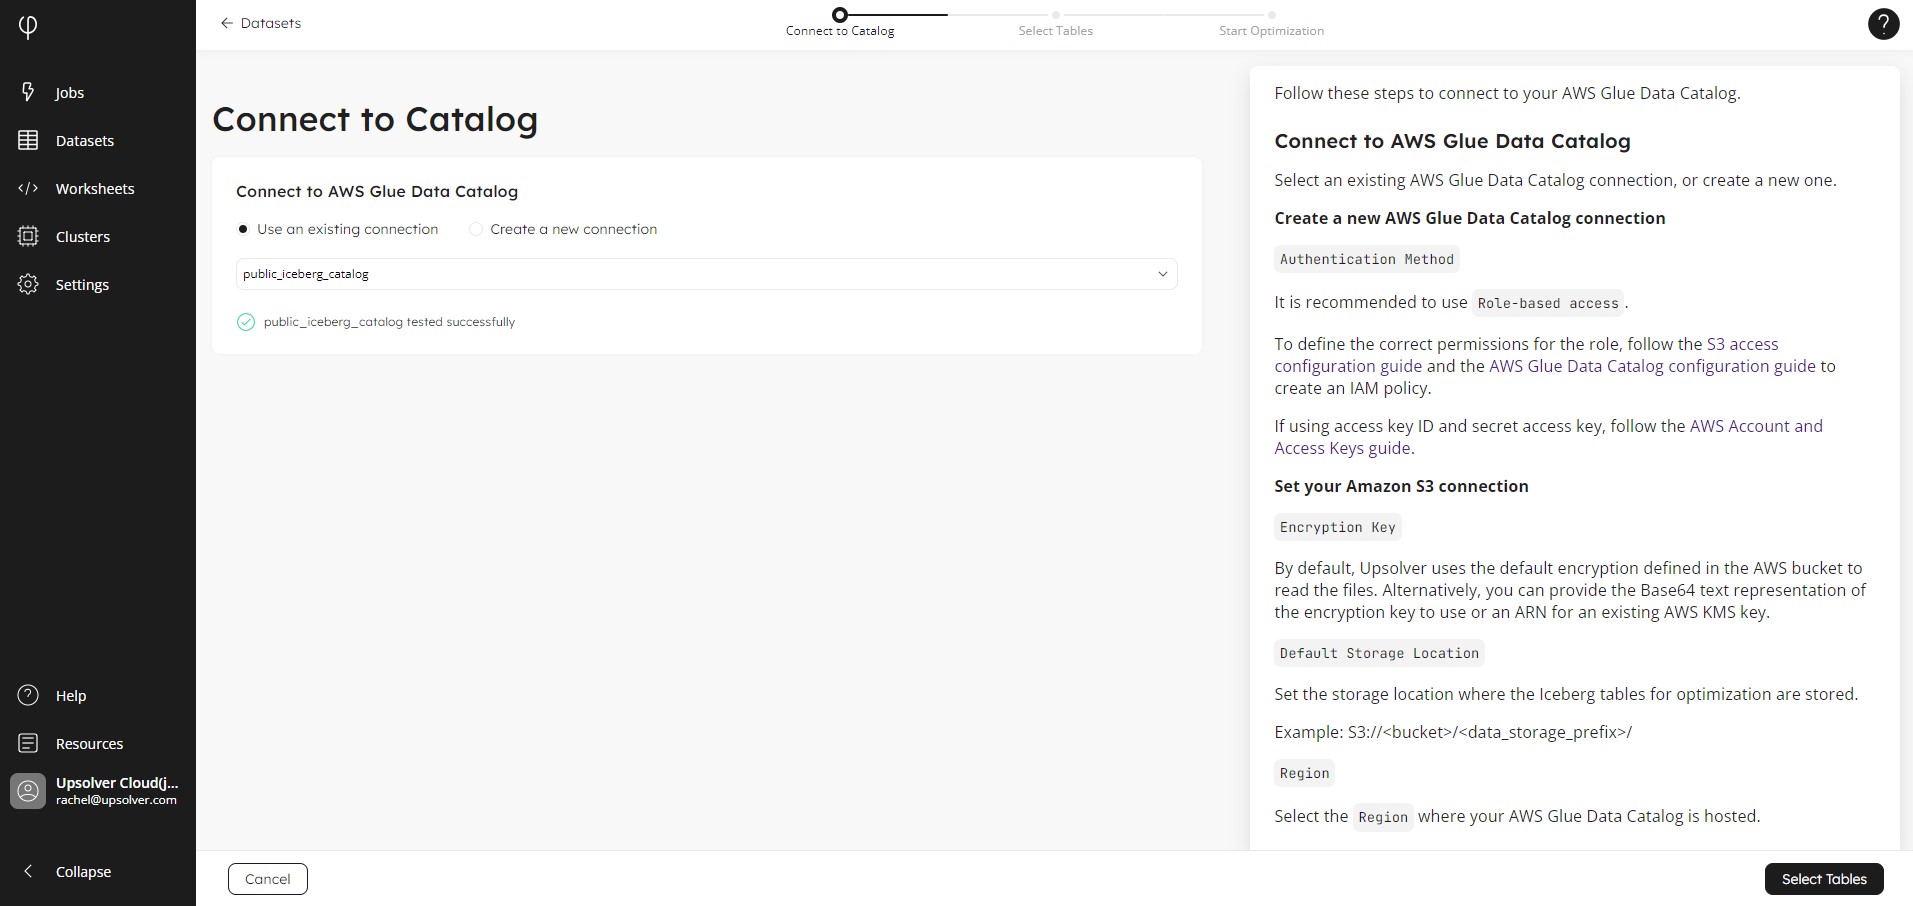
If you are creating a new connection, give your connection a name and enter the required credentials. When you are done, click Select Tables to navigate to the next screen.
Step 2
Select tables for analysis
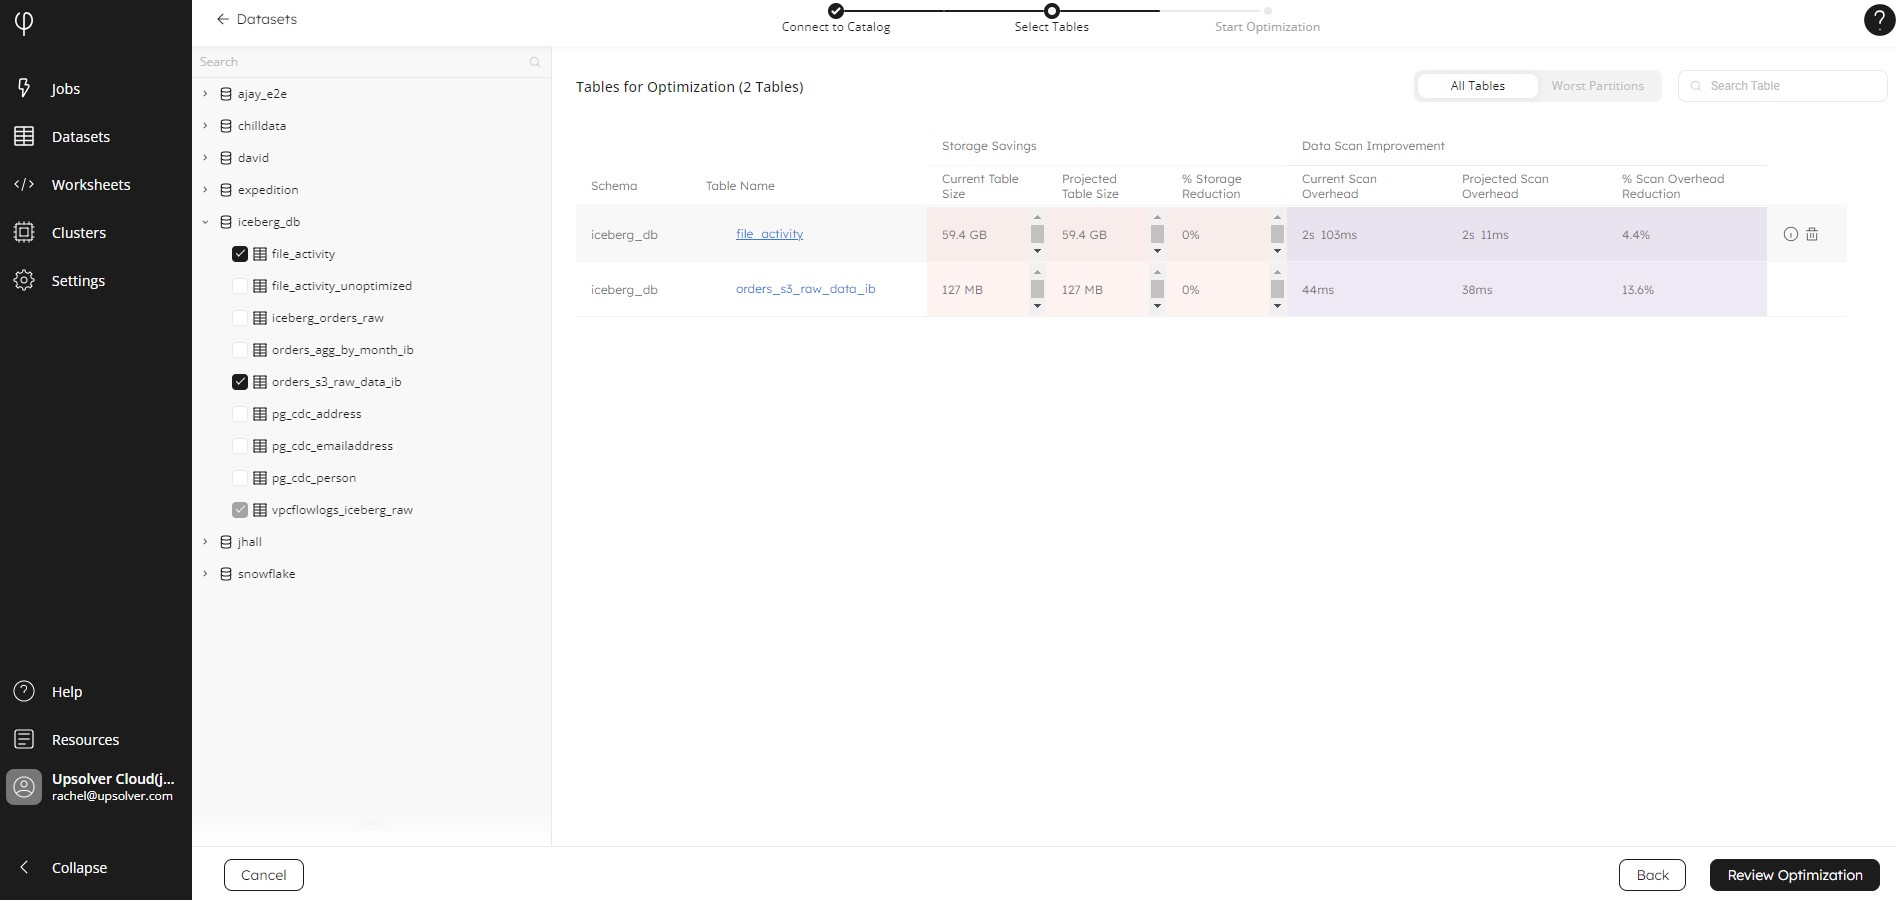
Having connected to your catalog, you will then see Datasets, where you can select tables for optimization. In the tree on the left-hand side, all your Iceberg tables will be visible. You may need to expand a schema to expose the tables in the navigation tree. Here, you have two options:
Click on a table name in the tree to view estimated storage savings and data scan improvements.
Or click the checkbox next to a table name to add it to the optimization process.
Note that in the top right-hand corner of the screen, you can toggle between All Tables and Worst Partition. This enables you to tackle the files that would benefit the most from optimization, should you wish. Next, either click Worst Partitions, or click on one or more table names in the tree that you want to analyze. Your selection is added to the analysis table:
Step 3
View the statistics for your tables
Now that you have added some tables, Upsolver will look at the metadata for each table to determine how much storage space can be recovered and therefore how much this will reduce the scan overhead.
In the table, notice the Current Size of the table, and the potential Storage Reduction size and percentage savings that Upsolver expects to gain after running a compaction operation. Then look at the Current Scan Overhead, which shows how long a scan presently takes, and how much Upsolver estimates this can be reduced by:
Next, we will look deeper in the statistics for an individual table. In the overview table, under Table Name, click on a table to open the table statistics modal:
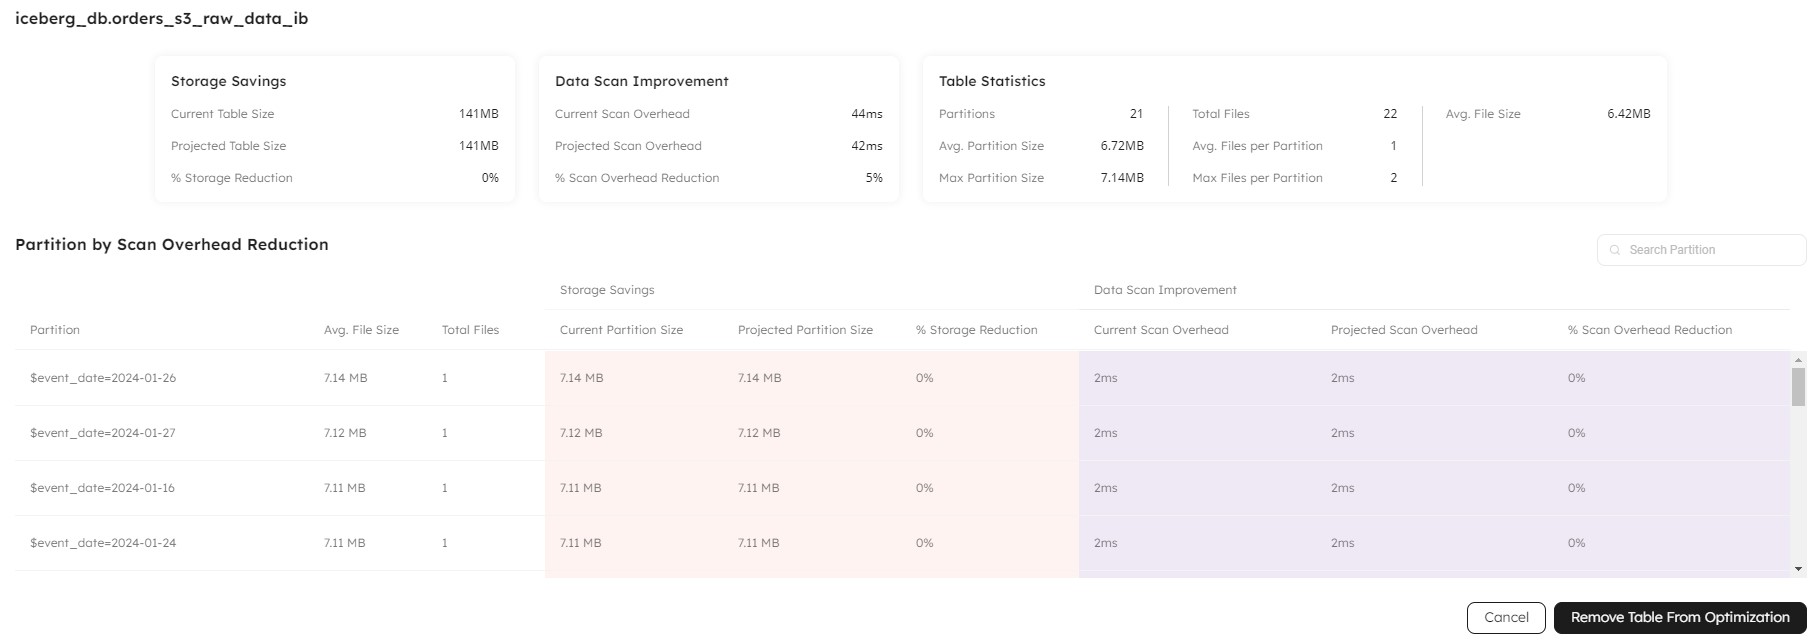
The statistics modal provides more information about the partitions that comprise your table. In the Table Statistics card, notice how many partitions you have in the table, and the average and maximum sizes. Then, see how many files you have, and the average and maximum size of the files in each partition:

Next, look at the Partition by Scan Overhead Reduction table. Upsolver scans all the partitions in your table and calculates the partitions that would deliver the most gains after optimization. Click Add Table to Optimization, which closes the modal and returns to the Datasets screen.
Repeat the process to view the statistics for a table and add it to the optimizer, or click the checkbox next to the table name in the navigation tree.
Step 4
Review your table selection and start the optimizer
Now that we have identified the tables we want to optimize, click the Confirm Optimization button. You will then see the SQL statement for running the optimization process. Optionally, you can click Edit in Worksheet to manually amend the code, or use the Copy SQL button to work with it outside of Upsolver:
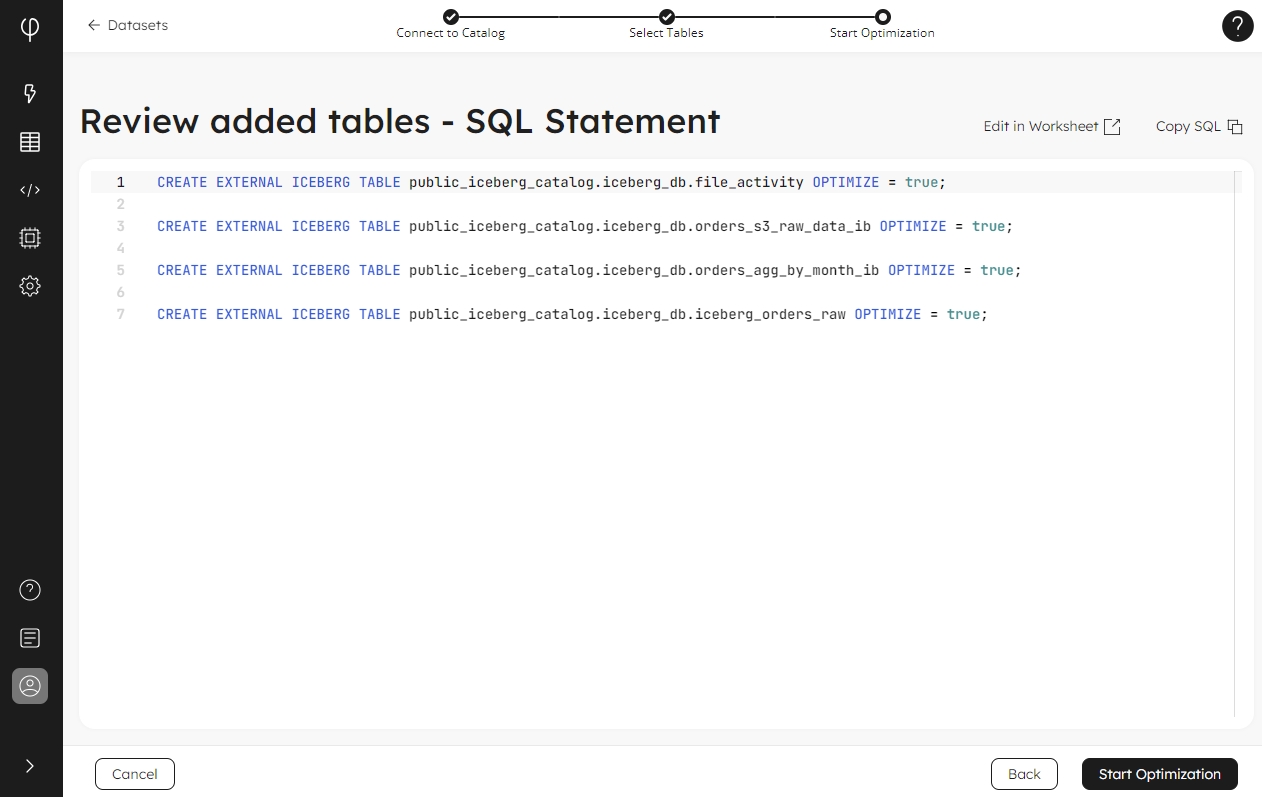
Review the code, and then click Start Optimization. Upsolver begins compacting and tuning your tables, and will continue to do so until you remove the table from the optimization process.
Step 5
Monitor the compaction process
After starting the optimization process, Upsolver returns you to the Datasets screen so you can monitor the process and view storage savings. In the tree, click on a table you previously selected for optimization to display the Table Statistics tab:
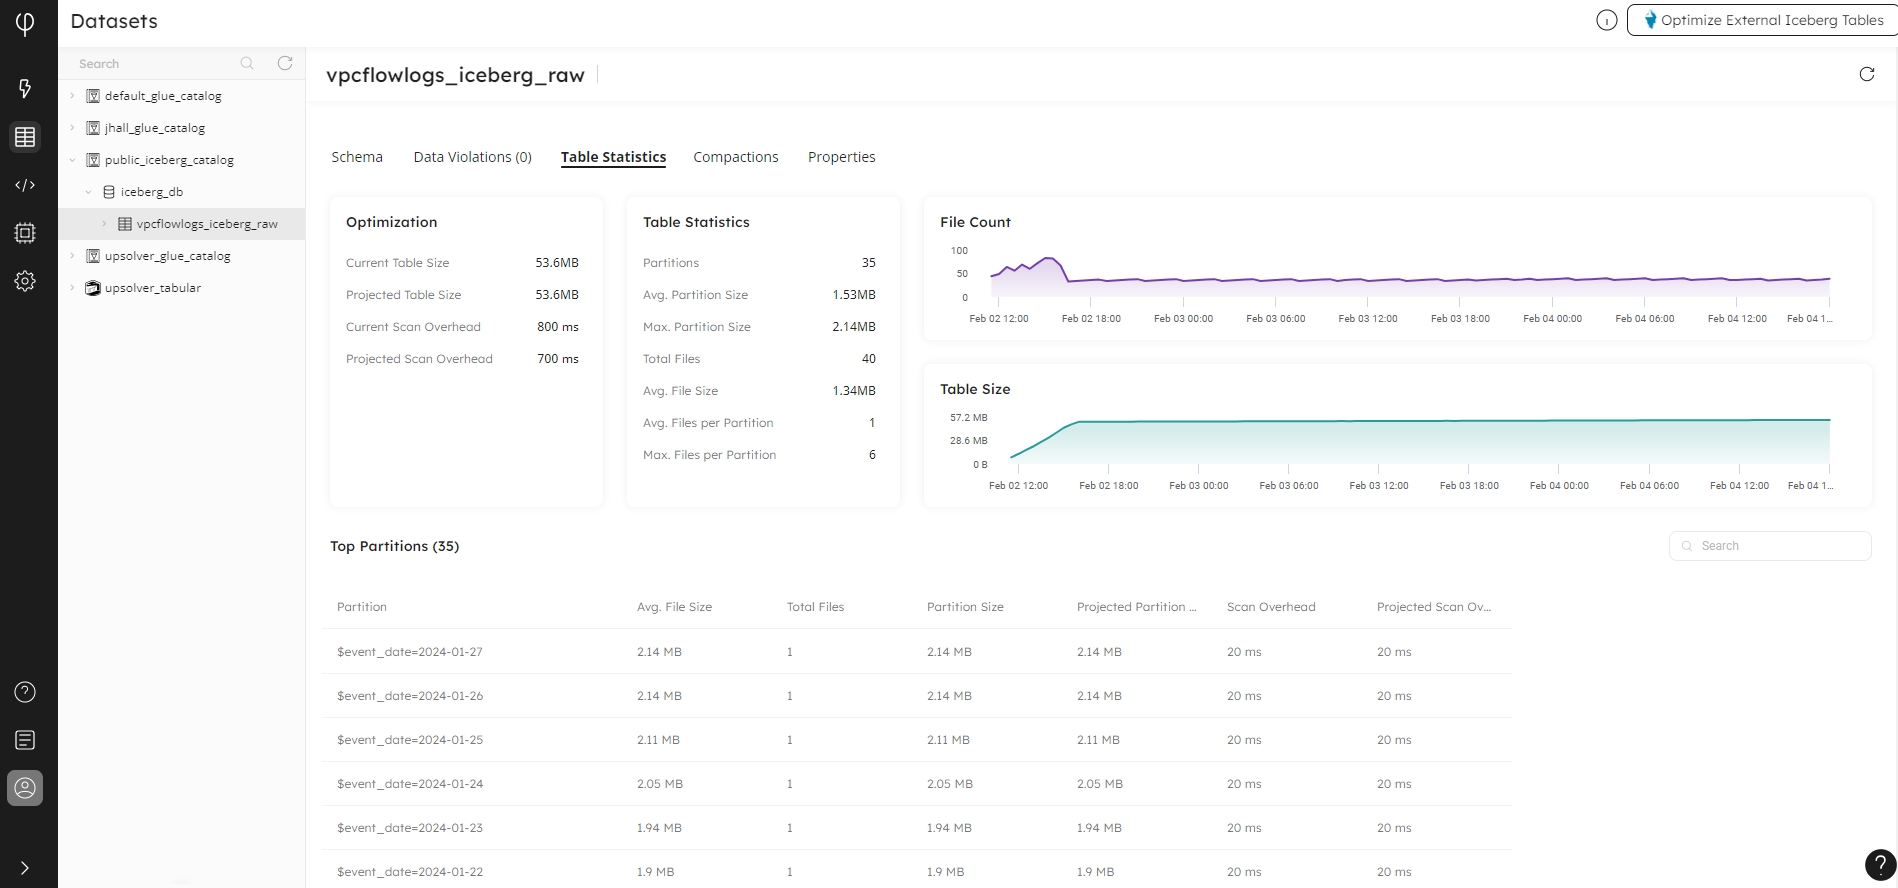
Upsolver continues to monitor your table to ensure it remains performant and will run a compaction when necessary and according to best practice. You will notice the graphs in the Total Files and Table Size update over time with the natural flow of data into your table and the ensuing compaction:
Data is added to your table, increasing the number of files and the table size, the graph lines will go up.
The compaction process runs, and the number of files is reduced along with the size of the table, and the graph lines go down.
Learn More
For more detailed information on the metrics in this tab, please see Table Statistics.
To view compactions that are currently running on your table, click the Compactions tab:
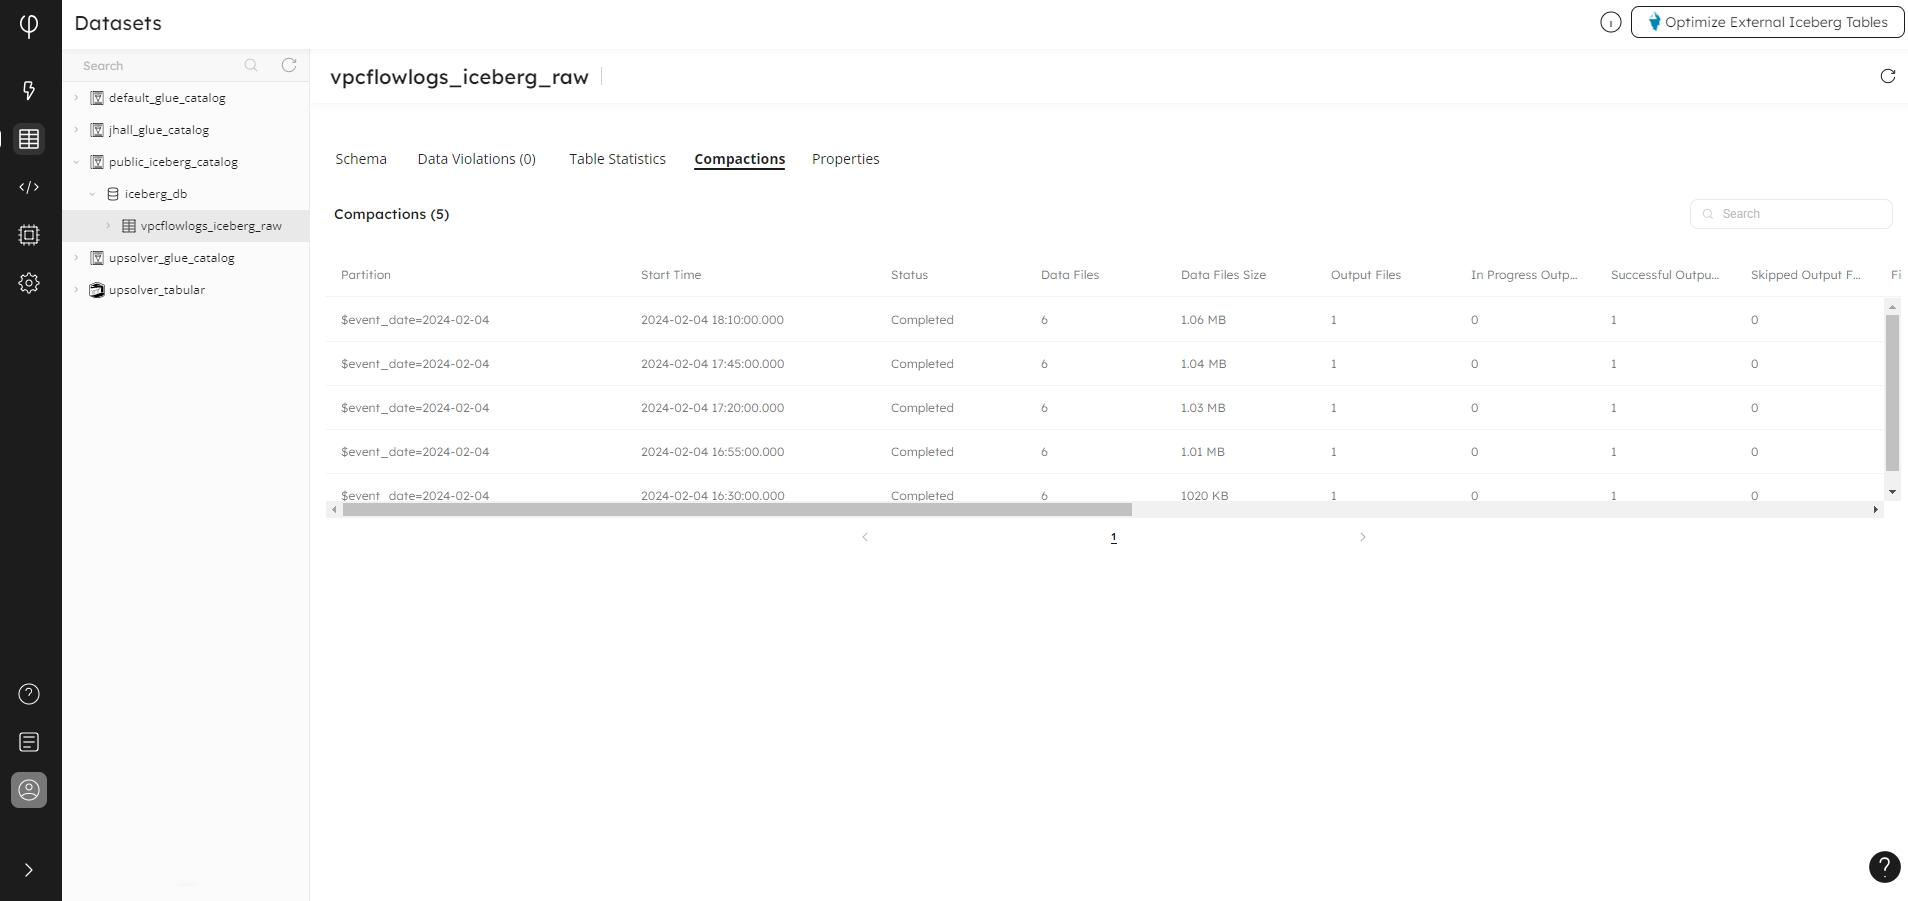
In the Compactions table, notice the Start Time and Status columns, which show the tuning work that has completed successfully or is currently running. Scroll the table to the right to view the metrics for each partition. Notice the File Size Reduction values that indicate the storage savings that the optimizer has made on your table.
Learn More
For more detailed information on the metrics in this tab, please see Compactions.
Step 6
Adding and removing tables from the optimizer
In the Compactions tab, in the top right-hand corner of the screen, notice the + Add Tables for Optimization button. Click back to the Table Statistics tab: the button is also displayed here. To add more tables, click the button to return to the main optimizer screen, and make your selections using the instructions in Step 2 and Step 3.

On the Table Statistics tab, click the button - Remove Table from Optimization. This opens the confirmation message pop-up. In the pop-up, notice the SQL Statement for removing the table from the optimization process. Click Copy if you want to paste this into a worksheet, where you can alter this statement and run it manually. Otherwise, click Remove Table from Compaction - which does not remove the original table or data - to stop Upsolver from tuning the table, or click Cancel to return without saving your changes.
Conclusion
In this how-to guide, you learned how connect to your data catalog and then view analysis results to discover which tables would benefit from optimization. Then, you ran the optimizer on a selection of tables, and viewed the performance metrics. You also learned how to add more tables to the optimizer, and remove a table from the optimizer.
Try it Yourself
To tune your Apache Iceberg tables using the Upsolver Iceberg Table Optimizer, follow these steps:
Connect to your data catalog.
Analyse your Iceberg tables to find files that require optimizing.
Run the optimizer to tune the files and regain space and speed up queries.
Open Datasets to view table and compaction statistics, and observe the space saving benefits of the compaction process.
Add or remove tables to suit your requirements.
Learn More
Please see the Datasets reference to learn more about the Table Statistics and Compactions tabs and explore all available metrics.
Last updated
